|
James G. Nagy
Department of Math and Computer Science Emory University nagy@mathcs.emory.edu |
Dianne P. O'Leary
Department of Computer Science University of Maryland oleary@cs.umd.edu |
This document contains animated gif files that pop open and play when appropriate links are activated. For best viewing, we suggest the following instructions:
This document has two companion "papers"; see [3] and [4].
We compute images in a variety of ways:
In many of these computations, this statistical information can be computed; see, for example, [3]. Even if it is available, however, it must be displayed to the viewer in a visually useful manner. In this work we focus on displaying such confidence information in a novel way as a confidence image that gives the viewer valuable information on which features in the image can be trusted.
We present an algorithm called Twinkle that gives the viewer visual insight into uncertainties in the computed image. The algorithm is useful whether the confidence information is in the form of a confidence interval or a distribution of possible values. We demonstrate how to display confidence information in a variety of applications: weather forecasts, intensity of a star, and rating a potential tumor in a diagnostic image. Even so, these examples are merely indicative of the types of situations in which the Twinkle technique can be used.
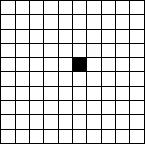
2. Displaying Confidence Images Based on Pixel Estimates
Suppose that for each pixel in an image, we compute an estimate xi of its true value as well as a confidence interval [li, ui] which is guaranteed with α % certainty. In other words, if we repeated the data gathering 100 times, we would expect that α % of the images would have each pixel value within its confidence interval. The collection of confidence intervals forms the confidence image. We are left with the task of displaying a confidence image in some useful way.
To do this, we developed an algorithm called Twinkle_image. We generate a sequence of images, each with pixel values contained in the ranges defined by the confidence image. Thus, in each of these images, pixel value i is taken to be a random value chosen from the interval [li, ui]. We display this sequence of images as a movie, running the frames at a rate so that the change in frame is barely perceptible to the viewer. By comparing the movie with the image x, the viewer can conclude with α % confidence that features that persist in the frames of the movie are real. Those that appear to flicker (or ``twinkle") could be either real or artifact.
We show two examples for illustration. Jorge E. Pinz{\'o}n (private communication) tells us that he is using a similar technique to display uncertainties in the characteristics of ground cover, estimated by satellite images at NASA Goddard.
Example 1: Suspected tumors. Figure 1 is an example computed using Matlab. Suppose that medical imaging has produced this image. A physician might reasonably conclude from this data that there are three masses, and a treatment option appropriate to this conclusion would be chosen.
If the confidence intervals are such that the images in the left side of Figure 1 are typical of those within the 95% confidence level, then this conclusion would be justified. The movie of such images would have barely perceptible flicker, and the three masses would be persistent features.
But if there is more noise in the measurements, or more uncertainty in the image reconstruction, then perhaps, in the movie of images one would observe the three suspected masses flickering, sometimes distinctly visible, but other times disappearing, demonstrating the uncertainty in their existence.
In both scenarios, the clinician can make better decisions if presented with confidence images rather than just the reconstructed image of Figure 1.
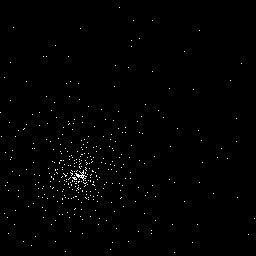
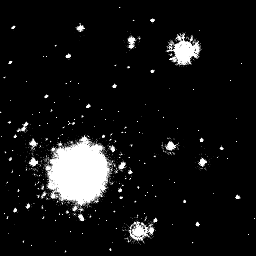
Example 2: Star Intensity.
Errors in the design of the original optics for the Hubble
Space Telescope Wide-Field Planetary Camera mean that rather
complicated deconvolution techniques need to be applied in
order to reconstruct images taken before the repairs. We
obtained data from
ftp.stsci.edu,
intended to simulate a star cluster as it would appear
in the camera image.
The left image of
Figure 2.
is the true
image, while the right is the camera image.
We focus on an isolated star in the upper right corner.
| True image. | Blurred image. |
|  |
| True subimage. | Blurred subimage. |
 |
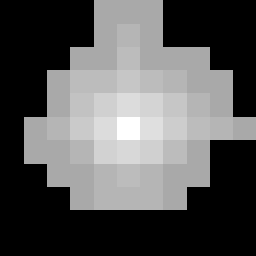 |
Sophisticated techniques are necessary to deblur the image: we need to take into account the spacial variation of the blurring function [1,2] and, in order to avoid ``ringing" artifacts in the reconstruction, we need to add side constraints that the pixel values should be nonnegative. The result of such a reconstruction is shown in Figure 3. Bright stars can oversaturate an image, washing out dimmer stars and other objects, so we display images of the actual pixel values along with images of the log of the pixel values. The top two images show the true subimage, and the second two are the reconstructed one.
| True subimage. | Log of true subimage. |

|  |
| Reconstructed subimage. | Log of reconstructed subimage. |
 |
 |
For this example, we assumed the noise to be normally distributed with mean zero and standard deviation one, and 99.99% confidence images [3] were computed. A movie based on the log pixel values shows some change in the confidence images. However, a movie based on the actual pixel values shows that the confidence images are virtually indistinguishable from the reconstructed image, giving high confidence in the reconstruction of the star and enabling estimates of derived quantities such as star intensity, as well as error estimates for these quantities.
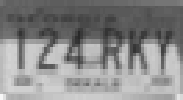
Example 3: Motion Blur.
Cameras are used as a means of law enforcement
by capturing the license plates of cars that fail to obey speed
limits or traffic signals. The images acquired may be contaminated
by motion blur, so we investigate the uncertainties involved in
processing such images.
We used a digital camera to image a stationary white van.
If the van were moving directly away from the
camera, then the motion blur would be in the vertical direction
in the image. We applied such a blur, spreading each pixel to
the adjacent 19 pixels, and then added a noise image with each
component chosen from a normal distribution and with the norm
of the noise equal to 6.0x10⁻⁵ times the norm of the image.
We then cropped
the image to size 36 x 66, to isolate the license plate.
Each column of pixels gives an independent reconstruction
problem of rank 36.
The results are in
Figure 4.
The original and blurred images are in the top row.
The second row contains the reconstructed images, using
the assumptions of nonnegativity of pixel values and
bounds of [0,1] respectively. The tighter bounds give
much better reconstructions.
| Original subimage. | Blurred subimage. |
|  |
| Reconstruction using nonnegativity constraint. | Reconstruction using [0,1] bounds. |
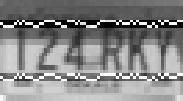 |
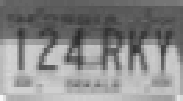 |
We also constructed a movie of the confidence images. In this case, the pixels surrounding the subimage are not known exactly, so the errors in these border values contribute to the error distribution, although this additional error has been neglected in the computation of confidence intervals. Our boundary conditions were quite crude: we implicitly assume that the pixel values in the 18 rows below this subimage are black. If we allow these values to vary, by increasing the size of the subimage, then the Chi-squared parameter must be increased because the rank of the matrix increases, and the bounds worsen; see [3] for further details.
3. Displaying Confidence Images Based on Feature Estimates
The previous version of Twinkle is quite useful when we have confidence intervals on the pixel values in the image. In some cases, though, it is the features in the image that have uncertainty. For example, a fluid dynamics computation might produce flow lines that have uncertainty. Or a topographical map or estimate of a function might have uncertainties in the locations of contour lines. In such cases, we apply a variant of the algorithm, Twinkle_feature. Each feature is represented by its distribution. For instance, we might know that the location of a contour has some expected value, some variance, and that the uncertainty is normally distributed. Twinkle_feature would then generate a sequence of contours chosen from this distribution and display them as a movie.
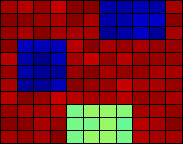
Example 4: Weather Forecasting. Weather forecasts of such things as high/low pressure regions, temperatures, precipitation, etc., are often displayed as isopleths; that is, lines connecting points of equal value of the particular variable in question. These isopleths are usually shown on maps as fixed lines which do not indicate any uncertainty in the forecast. An isotherm example is shown in the top left image of Figure 5.
Uncertainty in temperature is not easy to visualize from this single image. Suppose, as an example, that the vertical uncertainty in the isotherms is
We have demonstrated a useful tool, Twinkle, for visualizing statistical confidence that we can have in pixel values or in the features they form. The technique is useful whether the confidence information is in the form of a confidence interval or a distribution of possible values. Further work remains to be done on efficient algorithms for computing such confidence information, since the information displayed is only as reliable as the confidence calculations.
The work of the of D. O'Leary was supported by the National Science Foundation under Grant CCR 97-32022. The authors wish to thank Thomas Jackson, Emory University, for his help in creating the animated gif movies for this paper.