Introduction
Advanced Calculus for Data Science
Introduction
So far in calculus you have developed the tools to answer the following
questions about a function of one variable:
1 How quickly does the value of the
function change as the input
changes?
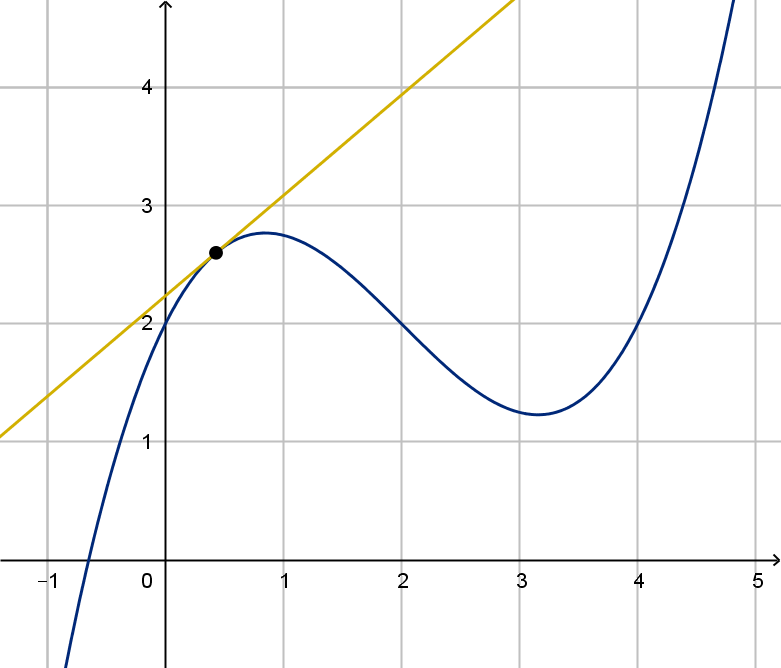
2 How do we estimate the value of
the function near a point?
2
Introduction
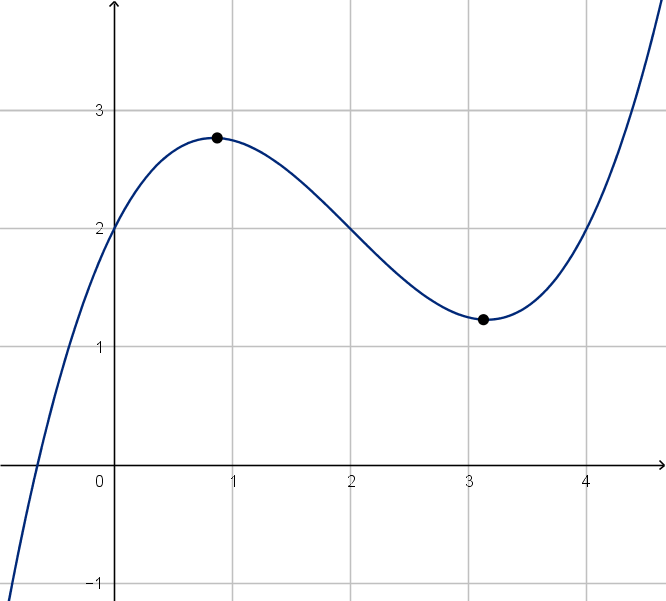
3 What are the maximum and
minimum values of the function?
3
Introduction
4 What is the area under the graph of
the function? What does it mean?

These are all useful tools, but they don’t necessarily apply to the types of
data that we encounter in the world.
4
Introduction
Data generally takes the form of a set of observations, rather than an
algebraic function. How do we perform calculus with such a set? We will
develop methods to approximate integrals and to approximate functions.
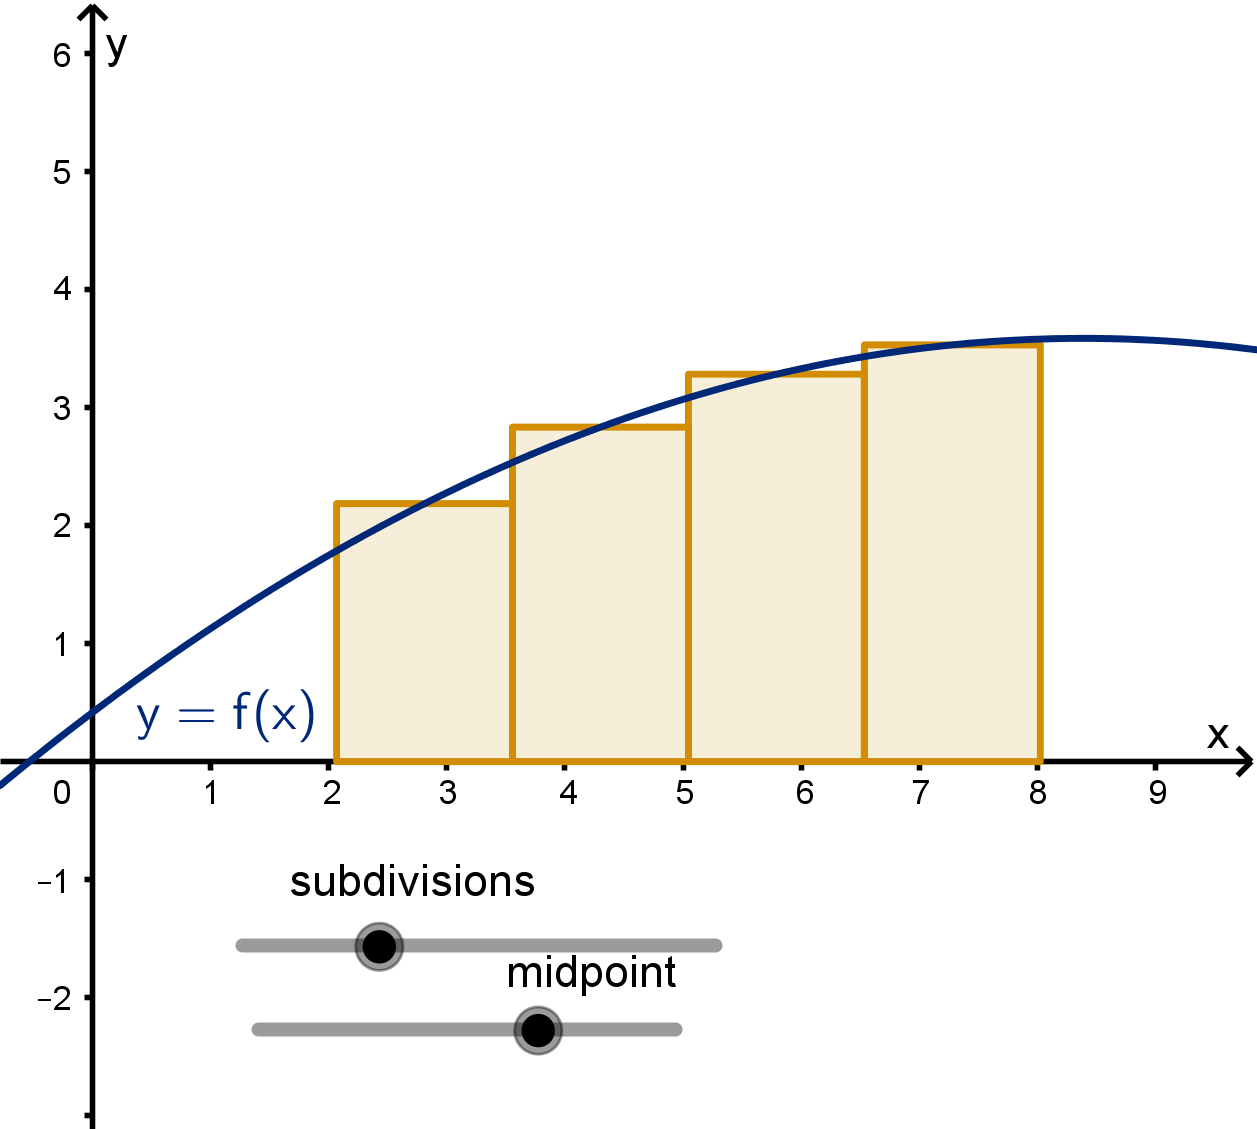
Figure: Approximations of an integral and of a function
5
Introduction
Many measurable quantities can be found to depend on the value of
multiple inputs. These are multivariable functions like z = F (x, y), where
z is a function of two independent variables. Examples appear in all the
sciences
1 Chemistry: V =
nrt
P
2 Physics: F =
GMm
r
2
3 Economics: P = P
0
e
rt
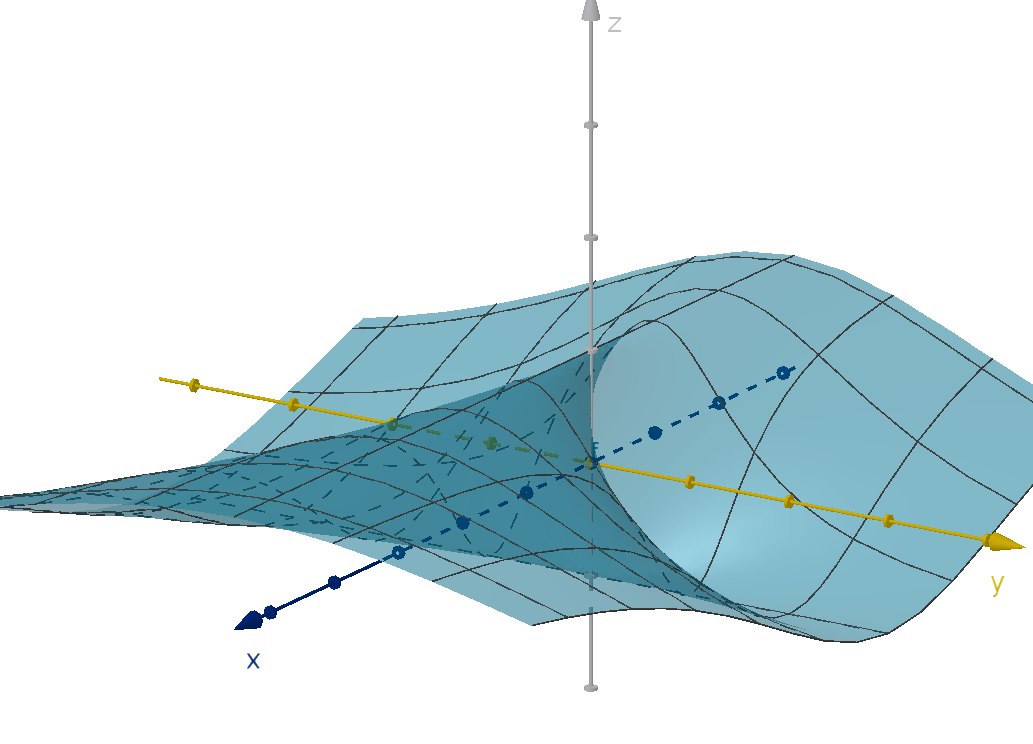
Figure: The graph of a two-variable function
6
Introduction
Furthermore, real world data does not come prepackaged with a
differentiable function to describe it.
Figure: Fitting a line to a set of data points
7
Introduction
The values of y may not be a function of x at all. Another view point is
to see (x, y) as a randomly chosen point in the plane. To model such
random choices, we use a two-variable density function.
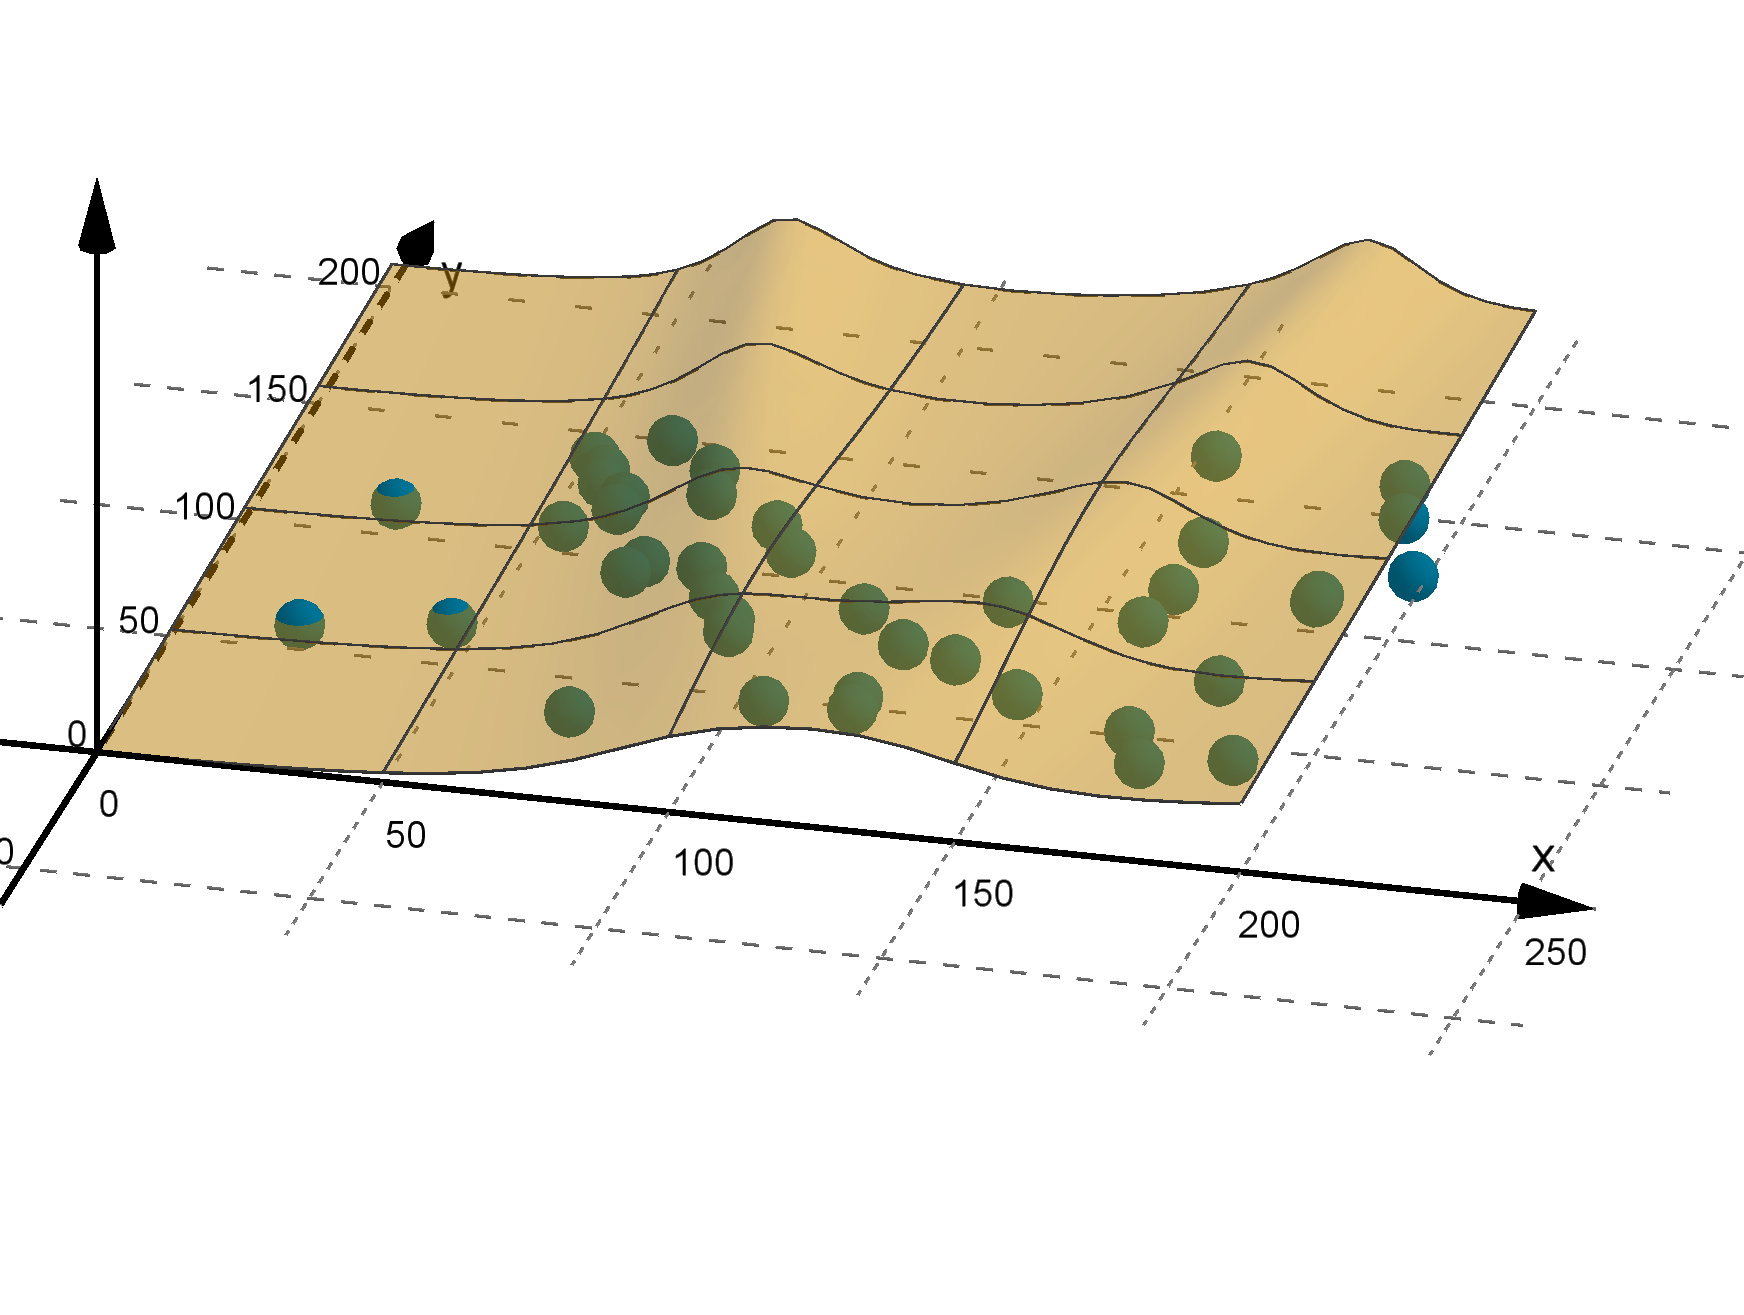
Figure: A function that models the outcomes of a random process
8
Introduction
Course Aims
By the end of this course, you should be able to:
Apply advanced methods to evaluate integrals.
Measure areas and volumes with integrals.
Implement code to compute integrals and derivatives and to
visualize functions.
Compute a probability using a continuous probability distribution.
Approximate or manipulate a function using its Taylor Series.
Produce or interpret a variety of visualizations of multivariable
functions.
Compute rates of change of multivariable functions.
Find maximum and minimum values of a multivariable function,
including with constraint.
Integrate multivariable functions over a variety of regions.
9